Trying Out Accelerometers Part 2 (MPU6050 & Node-RED MCU)
Introduction
In the previous post, I used an ESP32 and the MPU6050 accelerometer with code written in the Arduino IDE. This time, I will be using Node-RED MCU. With Node-RED MCU, you can flash programs created in the Node-RED editor directly onto a microcontroller.
▼For more details on Node-RED MCU, please refer to this post:
書籍紹介:『はじめてのNode-RED』/『はじめてのNode-RED MCU Edition』 - 趣味的ロボット研究所
Node-REDとは 一言でいうと、Node-REDはプログラミングが簡単にできるツールです。ビジュアルプログラミングの一種で、視覚的にわかりやすくなっています。▼百聞は一見に…

▼For the setup environment of Node-RED MCU (I am using a Raspberry Pi again):
Node-RED MCUの環境を構築する(ESP-IDF v5.1.1対応版、Raspberry Pi)
はじめに Moddable SDKがv4.2にアップデートされたことにより、Node-RED MCUの環境が大きく変化しています。特にESP-IDF v5に対応したことで、ESP-IDF v4のままだとエラ…
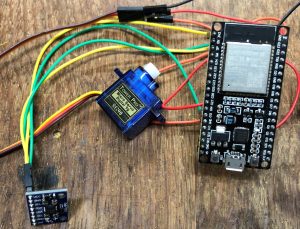
▼The previous article (the circuit remains the same):
Trying Out Accelerometers Part 1 (MPU6050, ESP32, and Dual-Core)
Info This article is translated from Japanese to English. Introduction In this post, I experimented with the MPU6050 accelerometer. This sensor was included in…

Retrieving Sensor Values
Configuring the Sensor Node
We will use the "Sensor" node provided by Node-RED MCU to retrieve the accelerometer data.
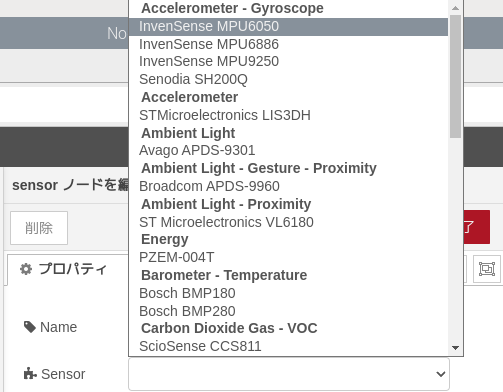
▼Place a Sensor node and select the sensor type.
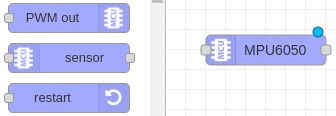
▼In this case, we use "MPU6050" by InvenSense.
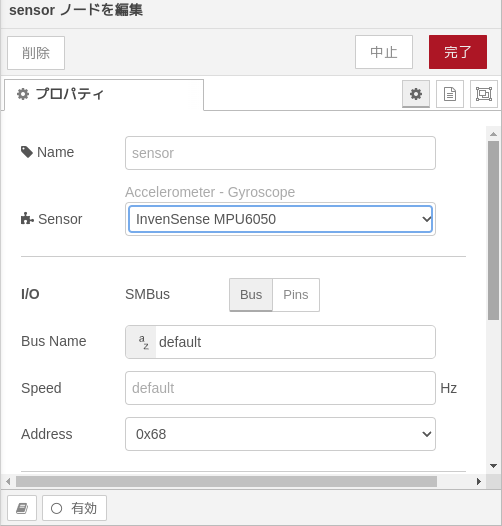
▼Once selected, you can configure detailed settings. The default address is 0x68.
Displaying in the Debug Window
Let's display the data in the debug window by connecting an inject node and a debug node.
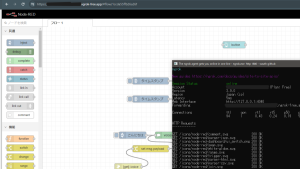
▼The flow on the ESP32 side:
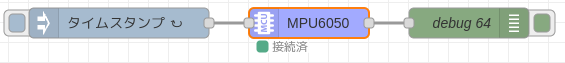
The inject node (labeled "timestamp") triggers the Sensor node at regular intervals.
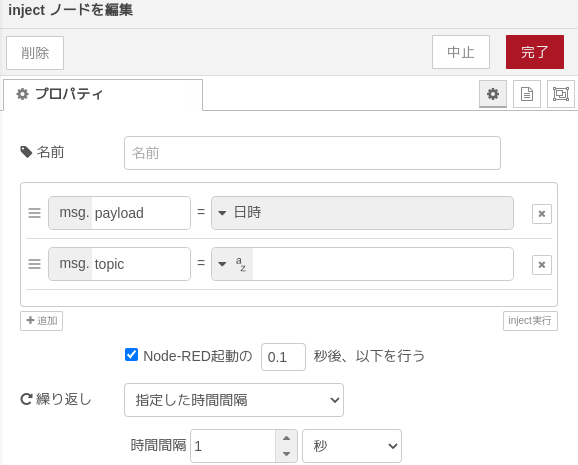
▼Configure the "Repeat" field at the bottom. Note that if the time interval is too short, the microcontroller may fail to process the requests.
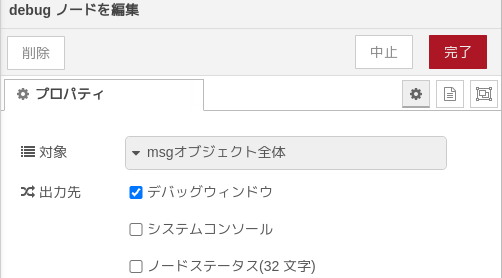
▼In the debug node, set it to "complete msg object" to view everything.
▼The debug window output looks like this:
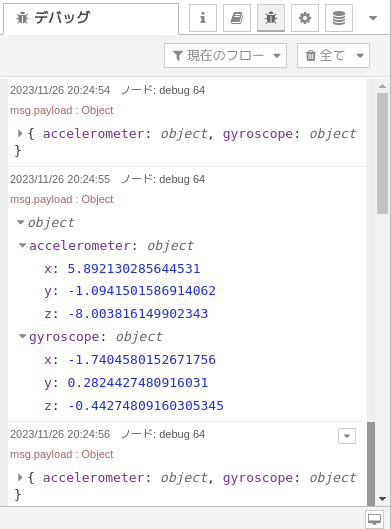
From the debug output, we can see that the X-axis acceleration is stored in msg.payload.accelerometer.x. Since receiving all data at once can be hard to handle, let's try displaying only the X-axis acceleration.
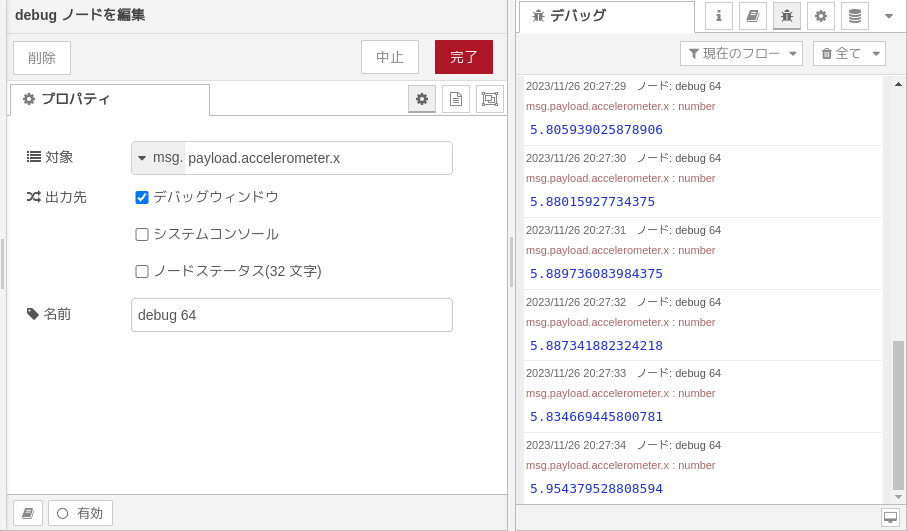
▼By specifying msg.payload.accelerometer.x in the debug node, you can isolate the X-axis value.
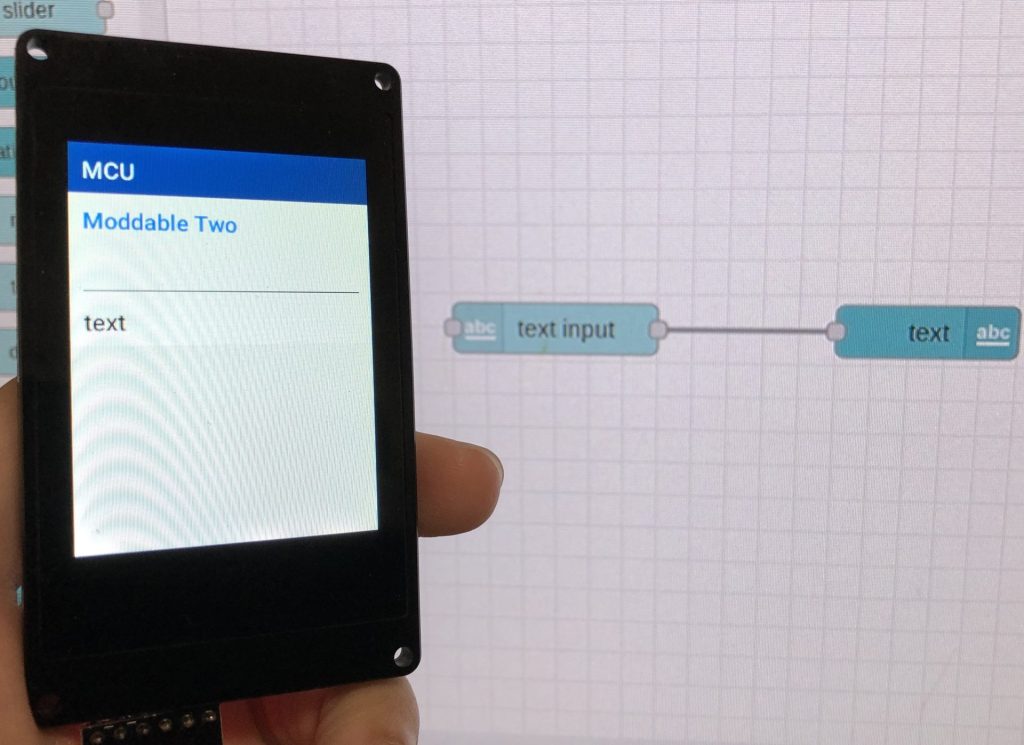
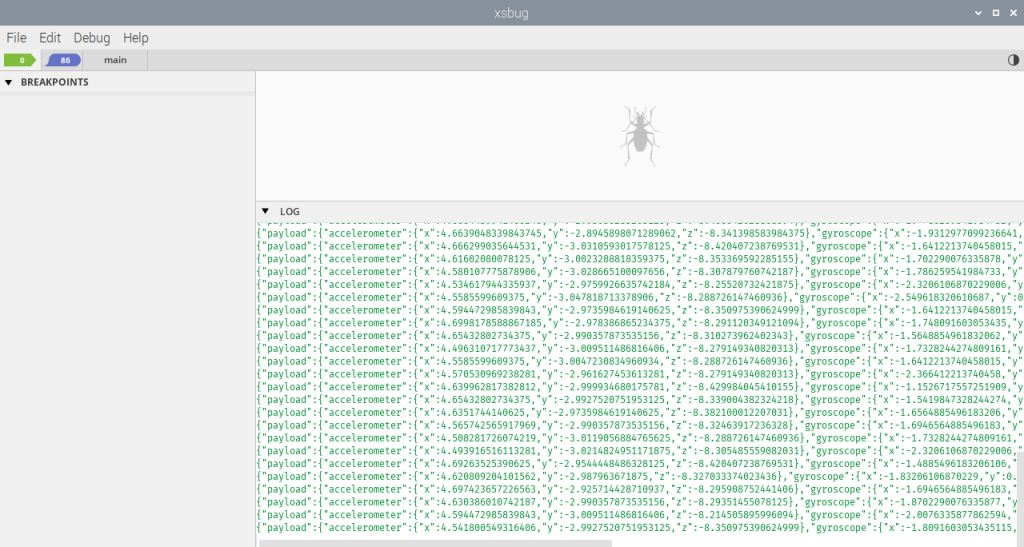
▼The sensor values are also displayed in "xsbug," the debugging tool for Moddable.
Creating Graphs in Node-RED
We will send the accelerometer data via MQTT and visualize it on the Node-RED side. Here, I am sending data to an "Aedes MQTT broker" running on Node-RED.
▼Article on MQTT communication with Node-RED:
MQTT communication with Node-RED (Node-RED MCU, M5Stack)
Introduction In this article, I used MQTT communication with Node-RED; MQTT communication is used to communicate with IoT devices and is said to be low-power…
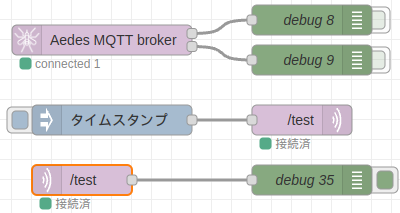
▼The flow on the Node-RED side. Ensure the topics in the mqtt in/out nodes match those on the ESP32 side.
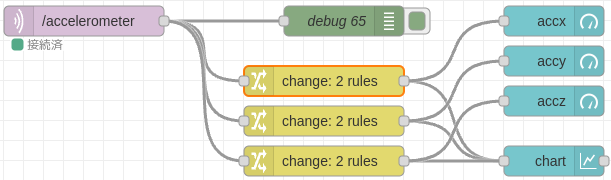
As confirmed in the debug window, the X-axis acceleration can be accessed via msg.payload.accelerometer.x. We will send this value to a node for graphing.
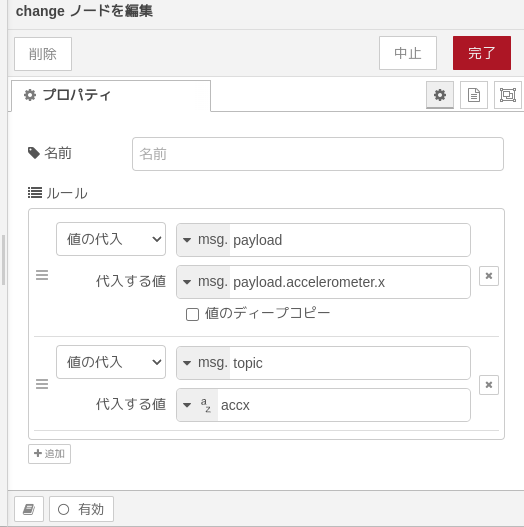
▼The configuration of the change node: I've also prepared nodes for the Y and Z axes.
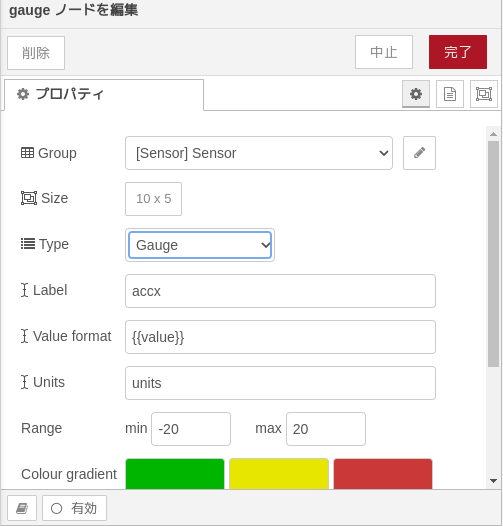
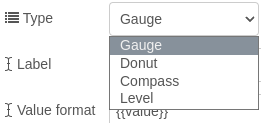
Next, configure the Node-RED Dashboard. I used the gauge and chart nodes from node-red-dashboard.
▼Most settings are default except for groups, but you can customize the type, color, label, and units.
Open the Dashboard screen to view the graphs.
▼You can open it from the Dashboard tab on the right side of the Node-RED editor.

▼The final graphs look like this. It makes me want to display them on a circular display!


▼Video of the system in action:
Finally
I successfully created a program for the accelerometer using Node-RED MCU and visualized the data in Node-RED. Although the exact units weren't explicitly stated, the value in the direction of gravity was roughly 9.8, so I assume it is in m/s².
One thing to note is that it doesn't work well if the processing speed is too high. At one point, the main Node-RED instance running the MQTT broker even stopped responding. While this setup is fine for environmental sensors like temperature and humidity which require slow update rates, Node-RED might not be the best choice for accelerometers in scenarios requiring high-speed responsiveness.
However, since it accurately detects the direction of gravity, it seems very useful for applications like tilting a display based on its orientation!